Welcome to scPower
- a statistical framework for design and power analysis of multi-sample single cell transcriptomics experiments-
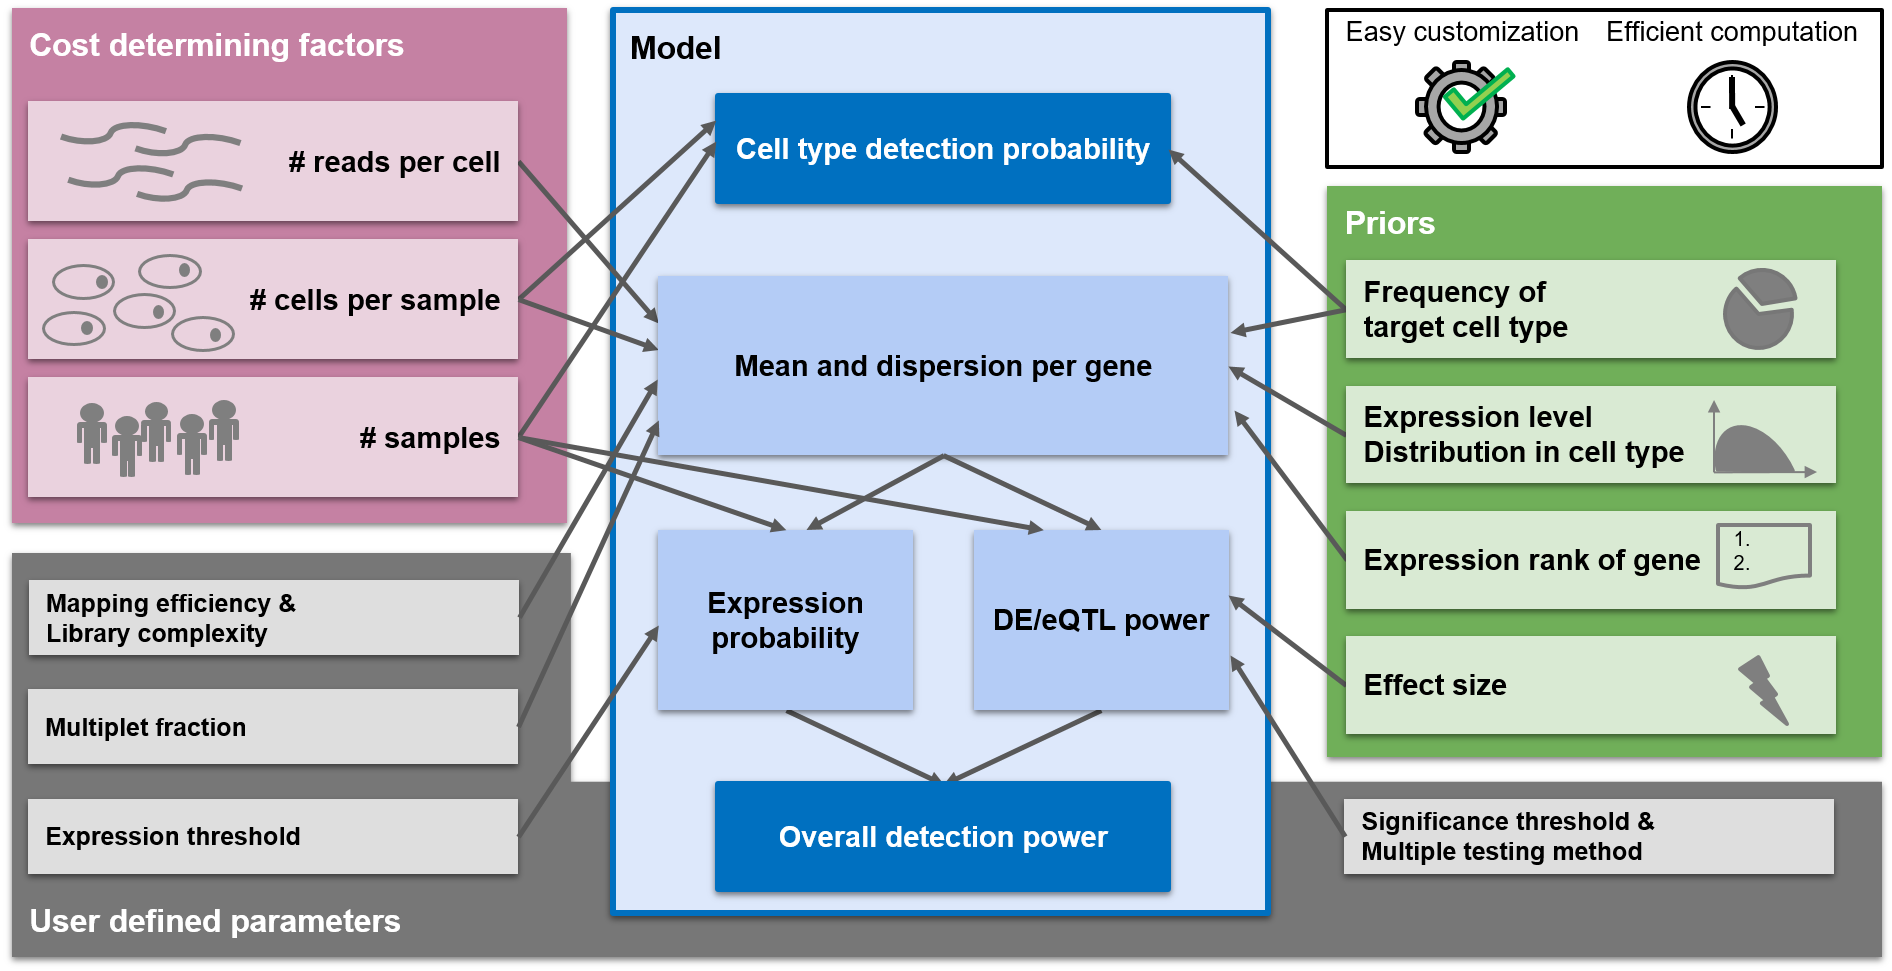
Experimental design suggestions are made in a way to optimize the power of the experiment. scPower offers optimization for two different experimental settings:
- Detect cell types (referred to as "cell type detection probability" in the figure above)
- Detect DE/eQTL genes (referred to as "Overall detection power")
Detect DE/eQTL genes
In this section you can find the parameter combination which maximizes the detection power of DE / eQTL genes. The main plot on the right side shows the detection power depending on parameter combinations. You can choose 2 out of the 3 cost determining factors (sample size, cells per person, read depth) to be displayed on x- and y-Axis. Due to the fixed budget, the third one can be determined and will be displayed as circle size. Depending on the overall budget, not all parameter combinations will be possible and some spots will stay white in the grid. An arrow called "selected study" points on the study with the highest detection power and the two plots below visualize the power curves for this study. The arrow can be set to any parameter combination by clicking on the main plot. The detection power is the product of the expression probability and the DE/eQTL power. The expression probability shows how likely it is that the DE/eQTL genes are expressed, while the DE/eQTL power shows how likely it is to detect the genes as significant, given that they are expressed. The two lower plots show the influence of the parameters on each of the probabilities. The plot on the left depicts the influence of the parameter on the x axis, while the parameter on the y axis is kept constant (taking the value of the selected study). The plots on the right shows the same for the parameter on the y axis. The power analysis can be tailored to the users experimental setup with a lot of different parameters. In case some parameters are unknown, the user can fall back to the defaults we provide. The parameters are divided into different categories:- General parameters
- Multiple testing correction Both the p-value and the multiple testing strategy can be chosen. We recommend using FWER adjustement for eQTL studies and FDR adjustment for DE studies.
- Mapping and multiplet estimation The more cells are loaded on a lane, the more multiplets are produced. These need to be discared before the analysis. Furthermore, since multiplets have a higher fraction of reads per cell than singlets, higher multiplet rates also reduce the target read depth.
- Expression cutoffs A gene is defined as expressed, if it has a certain fraction of UMI counts per gene in a certain fraction of individuals (both parameters can be set). This influences the expression probability.
- Special parameters The method of power calculation can be changed to speed up calculation or to increase accuracy (especially important for eQTL calculation).
Detect cell types
This section determines the power to detect a sufficient number of cells from a cell type of interest in each individual. This is important as a cell-type specific DE or eQTL analysis is only possible if enough cells of this cell type are detected. The method calculates the minimal number of cells per individual which are necessary to reach a sufficient power threshold.References
A detailed description of the complete model can be found in our publication: Schmid, K. T. et al. scPower accelerates and optimizes the design of multi-sample single cell transcriptomic studies. Nature Communications (2021) All code including an offline version of this website, build with R shiny, is available as an R package on Github. With the R package, the user can also fit and incorporate own priors for expression probabilities and effect sizes. This is due to runtime reasons not possible over the webserver. The package contains a detailed introduction vignette explaining all necessary steps for the inclusion of custom priors.Cost and experimental parameters
Multiple testing correction
Mapping and Multiplet estimation
Expression cutoffs
Special parameters
Detection power depending on design parameters
Click the Calculate optimal study button to update the plots with the current set of parameters.
Click on a specific point in the plot to visualize the exact trace in the plots below
Influence of design parameters on individual power components
Below a visualization how the design choices influence those power components.
The dashed lines shows the location of the selected study.
Study parameters
Required cells per person to detect rare cell types with a certain power
The 3-Clause BSD License
Copyright © 2023 Helmholtz Munich
Redistribution and use in source and binary forms, with or without modification, are permitted provided that the following conditions are met:
- Redistributions of source code must retain the above copyright notice, this list of conditions and the following disclaimer.
- Redistributions in binary form must reproduce the above copyright notice, this list of conditions and the following disclaimer in the documentation and/or other materials provided with the distribution.
- Neither the name of the copyright holder nor the names of its contributors may be used to endorse or promote products derived from this software without specific prior written permission.
THIS SOFTWARE IS PROVIDED BY THE COPYRIGHT HOLDERS AND CONTRIBUTORS “AS IS” AND ANY EXPRESS OR IMPLIED WARRANTIES, INCLUDING, BUT NOT LIMITED TO, THE IMPLIED WARRANTIES OF MERCHANTABILITY AND FITNESS FOR A PARTICULAR PURPOSE ARE DISCLAIMED. IN NO EVENT SHALL THE COPYRIGHT HOLDER OR CONTRIBUTORS BE LIABLE FOR ANY DIRECT, INDIRECT, INCIDENTAL, SPECIAL, EXEMPLARY, OR CONSEQUENTIAL DAMAGES (INCLUDING, BUT NOT LIMITED TO, PROCUREMENT OF SUBSTITUTE GOODS OR SERVICES; LOSS OF USE, DATA, OR PROFITS; OR BUSINESS INTERRUPTION) HOWEVER CAUSED AND ON ANY THEORY OF LIABILITY, WHETHER IN CONTRACT, STRICT LIABILITY, OR TORT (INCLUDING NEGLIGENCE OR OTHERWISE) ARISING IN ANY WAY OUT OF THE USE OF THIS SOFTWARE, EVEN IF ADVISED OF THE POSSIBILITY OF SUCH DAMAGE.